ECG of the Month – November 2022

A 16 year old girl with a history of recurrent paroxysmal palpitations and a structurally normal heart has the following 12-lead ECG recorded during an especially severe episode for which she obtained urgent medical assistance.

Following electrical cardioversion, the following sinus rhythm trace is obtained.

Which of the following is the correct diagnosis?

a)    Ventricular tachycardia
b)    Antidromic AV reentrant tachycardia
c)    Preexcited atrial flutter
d)    Orthodromic AV reentrant tachycardia with aberrance
e)    AV nodal reentry tachycardia with aberrance

Explanation:

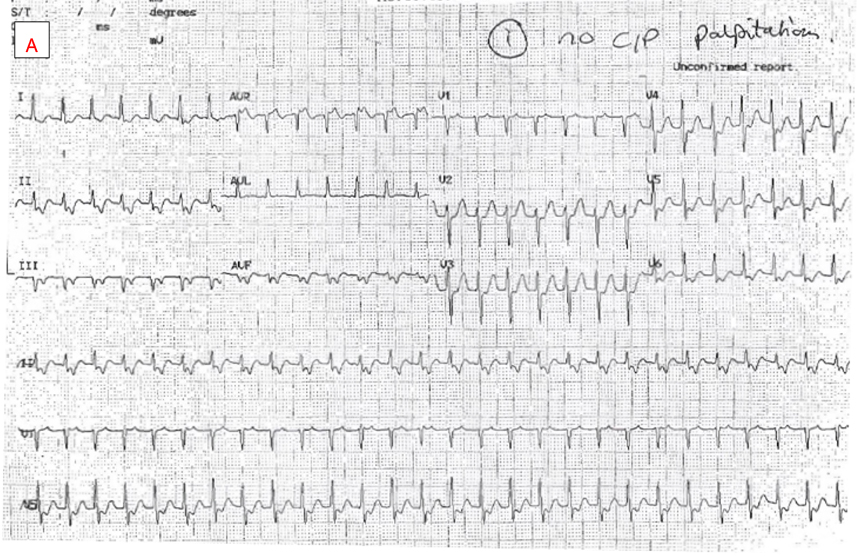
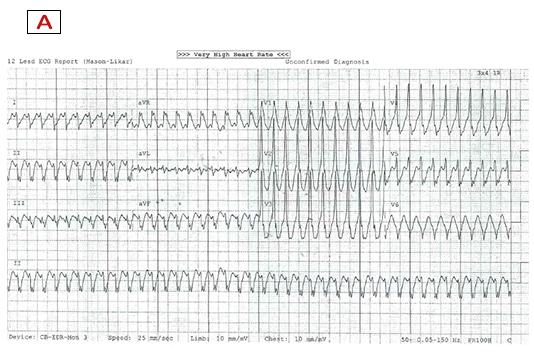
Panel A displays a very rapid, regular broad complex tachycardia at 250bpm. The differential diagnosis includes (i) ventricular tachycardia (VT), (ii) supraventricular tachycardia (SVT) with aberrance, and (iii) preexcited tachycardia. Note that (ii) is a two-part diagnosis i.e. it requires the presence of SVT along with aberrance, as without aberrance, SVT presents as a narrow complex tachycardia.
The term ‘aberrance’ conventionally refers to a functional block or delay in the bundle branches during tachycardia but which is not present in sinus rhythm. Functional bundle branch blocks display similar QRS morphology to fixed bundle branch blocks. Consequently,  morphology criteria consistent with a typical right or left bundle branch block should be present to diagnose SVT with aberrance as the mechanism of any broad complex tachycardia.
In Panel A, we see a monophasic R in V1 (rather than the typical rsR’ of a right bundle branch block) and a QS in V6 (rather than the typical Rs or rS). It is axiomatic that the presence of a QS pattern in V6 is strong evidence against aberrance as no combination of bundle branch or fascicular blocks can cause wavefront propagation to proceed entirely away from the normally latest activating posterolateral left ventricular region that is closest to V6. Thus the QRS morphology is not consistent with aberrance and hence d) and e) can be excluded.
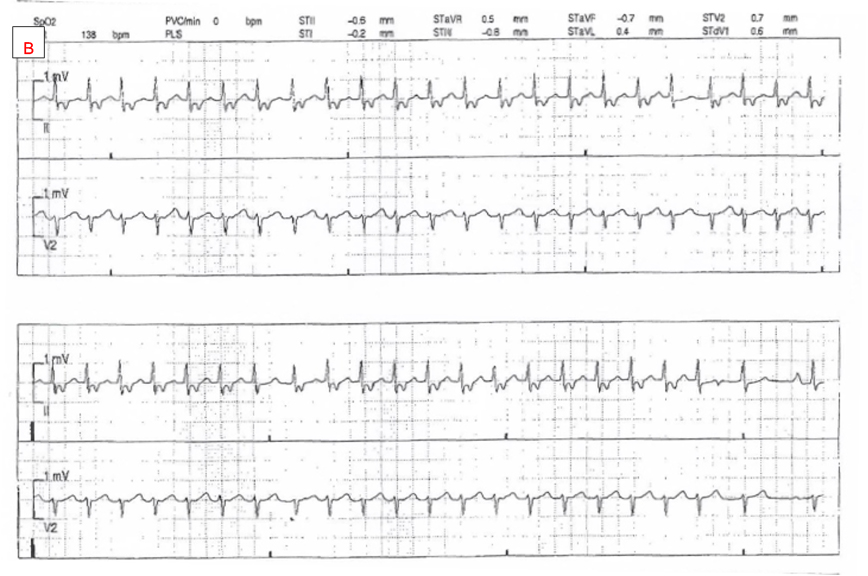
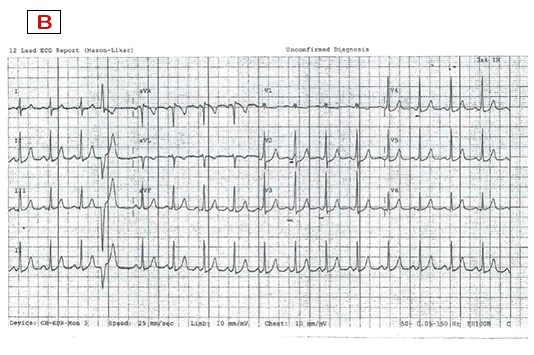
Panel B shows preexcitation in sinus rhythm with a short PR interval and delta waves. Combined with presence of symptomatic tachycardia, this establishes the diagnosis of Wolf-Parkinson-White syndrome. The positive delta wave and QRS in lead V1 and the inferior limb leads suggests the presence of a left lateral bypass tract with a ventricular insertion into the anterolateral (or superolateral) mitral annulus.
Both b) and c) are forms of preexcited tachycardia. This collection of tachycardias is defined by the presence of any antegrade (atrial to ventricular) conduction over a manifest bypass tract (accessory pathway) during broad complex tachycardia. This term is not mechanism specific and refers to a group of rhythms that exhibit at least some degree of preexcitation during tachycardia. Of these, only b) antidromic AV reentrant tachycardia exhibits ventricular activation entirely and solely over the bypass tract. This is because the AV conduction system is used retrogradely for activation of the atrium before reentry back to the ventricle over the bypass tract. As a result no antegrade conduction can occur over the AV conduction system during antidromic reentrant tachycardia.
It should be noted that, from the perspective of the ventricle, antidromic tachycardia is indistinguishable from option a) above, namely a focal ventricular tachycardia arising from a point source at the AV annulus. Such idiopathic ventricular tachycardias occur in structurally normal hearts.
Closer examination of the QRS morphology during tachycardia reveals a sharp intrinsicoid deflection in a number of limb leads and V5, in addition to a delta wave-like morphology with slurry initial forces across the majority of the precordial leads. This overall appearance is inconsistent with ventricular activation solely over a left lateral bypass tract (as it does in antidromic AV reentry tachycardia) or solely from a point source origin at the annulus (as it does in focal ventricular tachycardia). On the contrary, it implies that fusion is occurring in the ventricle with wavefront contributions from the both the bypass tract and AV conduction system during each cycle of tachycardia. Options a) and b) can thus also be excluded leaving c) preexcited atrial flutter (also known as atrial flutter with bystander preexcitation).
The diagnosis is also supported by the rapid rate and subtle suggestion of typical flutter waves in the inferior leads. This  patient’s young and otherwise healthy AV conduction system was able to conduct atrial flutter 1:1 to the ventricle as evidenced by the constant fusion in each QRS with conduction over the bypass tract.
This case highlights the importance of detailed and accurate QRS morphology assessment in diagnosing the mechanism of broad complex tachycardias.
An uncomplicated catheter ablation of the left lateral bypass tract was performed and she has had no recurrence of tachycardia or preexcitation at 1 year follow up.

The Answer:      c) Preexcited atrial flutter

Go to CSANZ Imaging Forum to discuss or post a question to A/Prof Haris Haqqani

Prevalence and prognostic impact of tricuspid regurgitation in patients with cardiac implantable electronic devices

Prevalence and prognostic impact of tricuspid regurgitation in patients with cardiac implantable electronic devices: From the national echocardiography database of Australia

The prevalence and prognostic impact of tricuspid regurgitation (TR) in patients with a cardiac implantable electronic devices (CIEDs) is not well understood. This month in IJC [1] we published the results of the largest retrospective study on the subject to-date using the National Echo Database of Australia (NEDA). We found that moderate or greater TR is prevalent (23.8%) and 2-fold greater than in those without devices. Furthermore, moderate and severe CIED-associated TR was associated with a 1.6 to 2.5-fold increase in all-cause mortality. The association of CIED-related TR with a poor prognosis was also especially pertinent in younger individuals. With an ageing population and expanding indications for life-saving device-therapy, these findings highlight the need for close follow-up of patients with device therapies and for clinicians to be cognisant of the potential adverse consequences of CIED-associated TR.

Sophie Offen, Geoff Strange, David Playford, David Celermajer and Simon Stewart.

[1.] Offen S, Strange G, Playford D, Celermajer DS, Stewart S. Prevalence and prognostic impact of tricuspid regurgitation in patients with cardiac implantable electronic devices: From the national echocardiography database of Australia. International Journal of Cardiology 2022. https://www.sciencedirect.com/science/article/abs/pii/S0167527322016710

Longitudinal Assessment of Structural Phenotype in Brugada Syndrome Using CMR

Longitudinal Assessment of Structural Phenotype in Brugada Syndrome Using Cardiac Magnetic Resonance Imaging

Recently published in Heart Rhythm O2 October 17, 2022  

With summary by author, Dr Julia C. Isbister 

Brugada syndrome (BrS) has traditionally been considered a channelopathy but in recent years, paralleling advancement in imaging techniques, subtle structural changes have been observed in a number BrS cohorts around the world. Cardiac magnetic resonance (CMR)imaging has revealed that patients with BrS have increased right ventricular and right ventricular outflow tract volumes compared to health controls. Focal fibrosis evidence by late gadolinium enhancement (LGE) has also been reported. Indeed, it has been postulated that BrS may be a focal cardiomyopathy rather than a pure ion channel disease.

This pilot study (n=18) represents the first time patients with BrS have been studied longitudinally with CMR and revealed that the myocardial changes can develop or progress over time. Most strikingly 22% of patients developed mid-wall LGE, typically associated with dilated cardiomyopathy, in the absence of other identifiable causes.

This work is hypothesis generating and we hope that the interesting results will prompt other groups around the world to review their patients with BrS to determine if progressive structural changes are observed in other cohorts. Ultimately, correlation of any progression of structural change with arrhythmic events and patient outcomes will be needed to determine the clinical implications of these observations and determine if serial structural assessment may aid risk stratification in BrS.

Isbister, J.C. et al, 2022, ‘Longitudinal Assessment of Structural Phenotype in Brugada Syndrome Using Cardiac Magnetic Resonance Imaging’ Heart Rhythm O2  

DOI: https://doi.org/10.1016/j.hroo.2022.10.004 

Read article in full


ECG of the Month – October 2022

A 57 year-old woman with a loop recorder in-situ for investigation of syncope presents to the emergency department with recurrent dizzy spells. Loop recorder tracings (1 & 2) are shown:

Image 1
Image 2

Visit the CSANZ Forum to discuss or post a question to A/Prof Alex Voskoboinik.

The Answer:

When reviewing any loop recorder / device tracings it is important to establish a symptom-rhythm correlation – this patient did not have any symptoms at the time of the two traces. Trace 1 represents clear artefact with non-physiological signals seen at baseline, then accentuated later in the trace. The true QRS complexes can be seen marching through and can be mapped out. It is important to have a high index of suspicion for ‘spurious’ / artefactual / undersensing for all logged episodes when this degree of artefact is seen. In trace 2 (reported as a long pause), one can appreciate gradual QRS signal attenuation likely related to patient position / movement. In fact, if one zooms in closely, the QRS complexes never disappear but just become low amplitude before gradually increasingly in amplitude. Fortunately this patient did not receive a pacemaker or defibrillator on the basis of these traces!


The carbon footprint of hospital diagnostic imaging in Australia

Summary by Dr Scott McAlister and Prof Alexandra Barratt 

As published in The Lancet July 2022.

When we think of carbon (CO2) emissions we don’t often think of healthcare, yet healthcare in Australia is responsible for approximately 7% of national emissions. Approximately 30% of these emissions come from building energy, with most of the rest coming from medical products and processes, such as medical tests, devices and interventions. Carbon footprintingof products and processes involves quantifying emissions from all phases of a product’s life cycle, including extracting raw materials such as ore or gas, manufacturing, use, and then disposal such as through landfill or recycling.

Recent Australian carbon footprinting has been done for pathology testing, intensive care, anaesthesia, and diagnostic imaging. The imaging study showed that one MRI scan has a carbon footprint of 17.5kg CO₂ equivalents (CO2e), which is the same as driving a car 145km, while one CT scan has a footprint of 9.2kg CO₂e, or driving 76km. These are much higher than X-rays (0.76kg CO₂e, 6km) and ultrasound (0.53kg CO₂e, 4km). Reducing imaging or using lower carbon modalities reduces emissions.

One hidden area for healthcare is individuals’ travel for conferences. A return business class flight from Australia to the USA results in approximately 12 tonnes CO2e. By contrast, our individual annual carbon budget in 2030 to keep the world below 1.5°warming will be 2.2 tonnes CO2e.

Authors: McAllister S. et al;  https://doi.org/10.1016/j.lanwpc.2022.100459

ECG of the Month – August 2022

ECG of the Month

A 28 year old nurse with a long history of paroxysmal palpitations has the following 12-lead ECG and 2-channel telemetry trace recorded during an episode.

Which of the following is the diagnosis?

  1. Orthodromic AV reentry tachycardia
  2. AV nodal reentry tachycardia
  3. Focal atrial tachycardia
  4. Slow atrial flutter
  5. Inappropriate sinus tachycardia


Explanation:

Panel A displays a short RP narrow complex tachycardia at a rate of approximately 160bpm. This is a supraventricular tachycardia (SVT). P waves can best be appreciated in the inferior limb leads, aVR and V1. There is a 1:1 RP relationship with the P wave falling in the first half of the RR cycle (short RP).

The P wave configuration is deeply negative in inferior limb leads and positive in aVR. It is isoelectric in the first half of V1 before becoming positive in the second half. This morphology is characteristic of a posteroseptal origin of atrial activation but is not diagnostic of tachycardia mechanism. It does however exclude option e) inappropriate sinus tachycardia, because this P wave configuration is inconsistent with a sinus origin of activation.

Panel B shows the rate of SVT has slowed to approximately 140bpm. All 12 leads are no longer available for P wave morphology analysis but the P wave appears unchanged in lead II. Notice that the RP interval is unchanged despite the slower tachycardia rate. Towards the end of the panel, we see a cycle where there is a dropped P wave (purple circle in between red arrows highlighting P waves). This phenomenon is seen again further along in the bottom of the panel. Tachycardia continues without reset despite the dropped P wave. This implies that atrial depolarization is not an obligate component of the tachycardia mechanism and thus option a) orthodromic AV reentry tachycardia can be excluded. This is because orthodromic AV reentry is due to the presence of a large loop circuit comprised of AV node, His-Purkinje system, ventricular myocardium, retrograde conduction to the atrium via an AV bypass tract, atrial myocardium, and then finally, the AV node again. Tachycardia is interrupted if any of these structures fail to depolarize. The dropped P waves seen here exclude orthodromic reentry because tachycardia continues at the same rate and is unaffected by the lack of atrial depolarization.

Additionally, it is readily apparent that with the dropped P waves the overall atrial rate is now lower than the ventricular rate. Consequently, the atrium cannot be driving this narrow complex tachycardia, hence options c) focal atrial tachycardia, and d) slow atrial flutter, can be excluded.

This leaves the correct answer as b) AV nodal reentrant tachycardia (AVNRT).

AVNRT is the most common form of SVT and is caused by reentrant excitation around perinodal transitional zone tissue. Neither atrial nor ventricular myocardium is required for ongoing AVNRT. While conduction block to the ventricle is commonly seen during AVNRT, block to the atrium is rarer. When conduction block to the atrium is seen during a narrow complex tachycardia however, it is very useful as it excludes most other common SVT mechanisms.

Provided by A/Prof Haris M. Haqqani – ECG of the Month – August 2022


Guideline-Directed Medical Therapy Before and After Primary Prevention Implantable Cardioverter Defibrillator Implantation in New Zealand

Guideline-Directed Medical Therapy Before and After Primary Prevention Implantable Cardioverter Defibrillator Implantation in New Zealand (ANZACS-QI 66)

Authors: Fang Shawn Foo, MBChB;  Mildred Lee, MSc; Katrina K. Poppe, PhD; Geoffrey C. Clare, MBChB; Martin K. Stiles, PhD; Andrew Gavin, MBChB; Matthew Webber, MBChB; Rod Jackson, PhD;  Andrew J. Kerr, MD;

Published in Heart Lung and Circulation 20 August 2022 with summary below by Dr Shawn Foo and A/Prof Martin Stiles.

Patients with heart failure and reduced ejection fraction are recommended to receive guideline directed medical therapy (GDMT). Many of these patients will also receive an ICD. This prompted Foo et al to look at almost 1700 ICD patients in New Zealand and, using prescribing records, determine which of these patients were receiving such medications at implant and one year later, and whether target doses were achieved. The specific classes of medication assessed were:

1. ACEi/ARB/ARNI
2. Beta blockers
3. Aldosterone antagonists
Note that the study period of 2009-2018 pre-dated the use of SGLT2 inhibitors.

Foo found that although 80% of patients received ACEi/ARB/ARNI, 84% beta blockers and 45% aldosterone antagonists, a dose ≥50% of recommended target dose (based on international guidelines) was achieved in only 52%, 52% and 35%, respectively. In fact, just 16% of patients received ≥50% of the target dose of all three medication classes.

For the >98% of ICD recipients who were alive at one year, the proportions of patients dispensed each class of medication remained largely unchanged. In fact, no matter the class of medication, the vast majority (67-81%) of patients had no change to their medication dose between implant and one year later.

This data is important as it captures an entire nation through its national database and demonstrates the inertia of heart failure therapy. This group of ambulatory heart failure patients would likely benefit from a more intensive up-titration of medication doses to ensurethat the (now four) classes of GDMT were all prescribed, where appropriate.

Some of the patients in this cohort would have been at maximally-tolerated doses yet not achieved ≥50% of the recommended target dose due to limitations of (e.g.) low blood pressure or kidney function, but there is clearly room for improvement. Perhaps a greater integrated response from ICD clinics and heart failure services would improve the numbers of patients at target dose, translating to improved outcomes in such endpoints as hospitalisations and mortality. In fact, some have argued that repeating the primary prophylactic ICD trials in today’s era of four-agent heart failure therapy might demonstratelack of benefit for ICDs over modern medical therapy. This study suggests that, until we do better in replicating the doses achieved in pivotal trials, medical therapy for heart failure in practice does not match ‘gold-standard’ GDMT of the trials.

Guideline-directed medical therapy for heart failure in patients before and after receiving primary prevention ICD implant 2009-2018.


Figure 1

Abbreviations: ACEi, angiotensin converting enzyme inhibitors; ARB, angiotensin receptor blockers; ARNI, angiotensin receptor neprilysin inhibitors; ICD, implantable cardioverter defibrillator; MRA, mineralocorticoid receptor antagonists.

Published: August 20, 2022.  DOI:https://doi.org/10.1016/j.hlc.2022.06.691

Link to full text

ECG of the Month – July 2022

A 38 year-old develops left arm and wrist pain while riding his bicycle. ECG is shown below. A coronary angiogram is planned. What does the ECG show?

Figure 1:

provided by Alex Voskoboinik July 2022

The Answer: Left arm – Right arm lead reversal

The emergency department doctors were concerned about T-wave inversion in lead I and aVL and diagnosed coronary ischaemia. In fact, this is a classic case of Left arm – right arm lead reversal. In this situation, Einthoven’s triangle flips 180 ̊horizontally so Lead I is inverted, aVL and aVRswitch places, as do leads II and III. The key to diagnosing lead reversals is that P waves, QRS complexes and T-waves are all inverted. In this case the p wave is negative in lead I which is not characteristic of sinus rhythm. Similarly in aVR, the p wave is positive which is not characteristic of sinus rhythm. A sinus p wave should usually be positive in all leads except aVR and is biphasic (pos/neg) in lead V1. Left arm – right arm lead reversal may appear similar to dextrocardia, however as opposed to dextrocardia there is normal precordial R wave progression in this case. This patient did not proceed to an angiogram.

Coronary Artery Anomalies in Young and Middle-Aged Sudden Cardiac Death Victims

Our recent paper,  ‘Prevalence of Coronary Artery Anomalies in Young and Middle-Aged Sudden Cardiac Death Victims’ examines the rate of coronary artery anomalies in the largest population of sudden cardiac death patients examined in Australia. From a population of approximately 1500 Victorians aged 1-50 years who experienced sudden cardiac arrest, over 700 underwent a comprehensive autopsy. A 1% rate of anomalies of coronary artery anatomy was identified, which is consistent with reported rates in angiographic, CT and other post-mortem series – this is reassuring that our dataset was representative of general findings.

However, within this 1% prevalence of coronary artery anomalies, not a single person had experienced their sudden cardiac arrest due to their coronary anomaly. All patients had clear alternative reasons for their death identified, such as another coronary artery occluded with acute thrombus, histological evidence of acute myocardial infarction or a ruptured thoracic aortic dissection.

This study is important, because it challenges earlier assumptions that coronary artery anomalies are a major cause of young sudden cardiac death. Early investigations into sudden cardiac death reported that coronary artery anomalies caused up to one-third of young sudden cardiac deaths. These studies included only a few dozen patients and were published several decades ago. However, citing these studies, both US and European guidelines have traditionally restricted participation in elite sport for patients with coronary anomalies.

Our dataset is not only the largest published in Australia, but also one of the largest in the world and our findings accord with contemporary figures from other major sudden cardiac death research teams. We hope that our data will prompt a re-appraisal and further investigations into the true role of coronary artery anomalies in young sudden cardiac death.

Summary by Dr Elizabeth Paratz

Available now as a preprint in The American Journal of Cardiology
Link to full article here:


Posts navigation